December 2018 ... Market slows, but has it bottomed out?
BC Home Sales Continue at Slower Pace
Vancouver, BC – December 14, 2018. The British Columbia Real Estate Association (BCREA) reports that a total of 5,179 residential unit sales were recorded by the Multiple Listing Service® (MLS®) across the province in November, down 33.1 per cent from the same month last year. The average MLS® residential price in BC was $718,903, a decline of 1.9 per cent from November 2017. Total sales dollar volume was $3.7 billion, a 34.3 per cent decline from November 2017.

“BC households continue to struggle with the sharp decline in purchasing power caused by the B20 mortgage stress test,” said Cameron Muir, BCREA Chief Economist. “Most BC regions are now exhibiting relative balance between supply and demand.”
Total active residential listings were up nearly 31 per cent to 33,500 units in November, compared to the same month last year. However, it should be noted that this compares to 2017, when active listings for the month of November were at their lowest level in more than 15 years.
Year-to-date, BC residential sales dollar volume was down 23.1 per cent to $53.4 billion, compared with the same period in 2017. Residential unit sales declined 23.6 per cent to 74,847 units, while the average MLS® residential price was up 0.7 per cent to $713,302.
-30-
Source:
| Cameron Muir | |
| Chief Economist, BCREA (British Columbia Real Estate Association) |
August 2018 - Vancouver East Side Stats

AUGUST 2018 - Vancouver West Side Stats

August 2018 - Latest Stats

Home buyer demand stays below historical averages in August
The Metro Vancouver1 housing market continues to experience reduced demand across all housing types.
The Real Estate Board of Greater Vancouver (REBGV) reports that residential home sales in the region totalled 1,929 in August 2018, a 36.6 per cent decrease from the 3,043 sales recorded in August 2017, and a 6.8 per cent decline compared to July 2018 when 2,070 homes sold.
Last month’s sales were 25.2 per cent below the 10-year August sales average.
“Home buyers have been less active in recent months and we’re beginning to see prices edge down for all housing types as a result,” Phil Moore, REBGV president said. “Buyers today have more listings to choose from and face less competition than we’ve seen in our market in recent years.”
There were 3,881 detached, attached and apartment homes newly listed for sale on the Multiple Listing Service® (MLS®) in Metro Vancouver in August 2018. This represents an 8.6 per cent decrease compared to the 4,245 homes listed in August 2017 and an 18.6 per cent decrease compared to July 2018 when 4,770 homes were listed.
The total number of homes currently listed for sale on the MLS® system in Metro Vancouver is 11,824, a 34.3 per cent increase compared to August 2017 (8,807) and a 2.6 per cent decrease compared to July 2018 (12,137).
The sales-to-active listings ratio for August 2018 is 16.3 per cent. By housing type, the ratio is 9.2 per cent for detached homes, 19.4 per cent for townhomes, and 26.6 per cent for apartments.
Generally, analysts say that downward pressure on home prices occurs when the ratio dips below the 12 per cent mark for a sustained period, while home prices often experience upward pressure when it surpasses 20 per cent over several months.
“With fewer buyers active in the market, benchmark prices across all three housing categories have declined for two consecutive months across the region,” Moore said.
The MLS® Home Price Index2 composite benchmark price for all residential properties in Metro Vancouver is currently $1,083,400. This represents a 4.1 per cent increase over August 2017 and a 1.9 per cent decrease since May 2018.
Sales of detached properties in August 2018 reached 567, a 37.1 per cent decrease from the 901 detached sales recorded in August 2017. The benchmark price for detached properties is $1,561,000. This represents a 3.1 per cent decrease from August 2017 and a 2.8 per cent decrease since May 2018.
Sales of apartment properties reached 1,025 in August 2018, 36.5 per cent decrease compared to the 1,613 sales in August 2017. The benchmark price of an apartment property is $695,500. This represents a 10.3 per cent increase from August 2017 and a 1.6 per cent decrease since May 2018.
Attached property sales in August 2018 totalled 337, a 36.3 per cent decrease compared to the 529 sales in August 2017. The benchmark price of an attached unit is $846,100. This represents a 7.9 per cent increase from August 2017 and a 0.8 per cent decrease since May 2018.
*Editor’s Notes:
1. Areas covered by the Real Estate Board of Greater Vancouver include: Whistler, Sunshine Coast, Squamish, West Vancouver, North Vancouver, Vancouver, Burnaby, New Westminster, Richmond, Port Moody, Port Coquitlam, Coquitlam, Pitt Meadows, Maple Ridge, and South Delta.
2. A national operations team conducts an annual review of the MLS® HPI model. This review was recently completed, which resulted in some revisions to the model in August 2018. Specifically, neighbourhoods where home sales over the past three years totalled 12 or less have been removed from the model due to a lack of consistent sample size. Neighbourhoods where sales have increased to 20 or more over the past three years have been added. Historical MLS® HPI data has been recalculated to reflect these changes.
The benchmark property descriptions for what constitutes a “typical” home in a given area have also been updated to reflect changes to current buying trends.
MLS® HPI benchmark prices represent the value of a “typical” property within a market. The HPI model creates a composite description for every neighbourhood and property type based on MLS® sales data for that specific area. What people typically purchase can change over time due to changes in affordability and buyer preferences. Therefore, it’s necessary for these descriptions to be occasionally updated.
The Real Estate Board of Greater Vancouver is an association representing more than 14,000 REALTORS® and their companies. The Board provides a variety of member services, including the Multiple Listing Service®. For more information on real estate, statistics, and buying or selling a home, contact a local REALTOR® or visit www.rebgv.org.
Market Stats for July 2018
VANCOUVER, BC – July 4, 2018 – With home sale activity dipping below long-term historical averages, the supply of homes for sale in Metro Vancouver* reached a three-year high in June.
The Real Estate Board of Greater Vancouver (REBGV) reports that residential home sales in the region totalled 2,425 in June 2018, a 37.7 per cent decline from the 3,893 sales recorded in June 2017, and a 14.4 per cent decrease compared to May 2018 when 2,833 homes sold.
Last month’s sales were 28.7 per cent below the 10-year June sales average. “Buyers are less active today. This is allowing the supply of homes for sale to accumulate to levels we haven’t seen in the last few years,” Phil Moore, REBGV president said. “Rising interest rates, high prices and more restrictive mortgage requirements are among the factors dampening home buyer activity today.”
There were 5,279 detached, attached and apartment properties newly listed for sale on the Multiple Listing Service® (MLS®) in Metro Vancouver in June 2018. This represents a 7.7 per cent decrease compared to the 5,721 homes listed in June 2017 and a 17.2 per cent decrease compared to May 2018 when 6,375 homes were listed. The total number of homes currently listed for sale on the MLS® system in Metro Vancouver is 11,947, a 40.3 per cent increase compared to June 2017 (8,515) and a 5.8 per cent increase compared to May 2018 (11,292). This is the highest this total has been since June 2015. “With reduced demand, detached homes are entering a buyers’ market and price growth in our townhome and apartment markets is showing signs of decelerating.”
For all property types, the sales-to-active listings ratio for June 2018 is 20.3 per cent. By property type, the ratio is 11.7 per cent for detached homes, 24.9 per cent for townhomes, and 33.4 per cent for condominiums. Generally, analysts say that downward pressure on home prices occurs when the ratio dips below the 12 per cent mark for a sustained period, while home prices often experience upward pressure when it surpasses 20 per cent over several months.
The MLS® Home Price Index composite benchmark price for all residential properties in Metro Vancouver is currently $1,093,600. This represents a 9.5 per cent increase over June 2017 and is virtually unchanged from May 2018.
Sales of detached homes in June 2018 reached 766, a 42 per cent decrease from the 1,320 detached sales recorded in June 2017. The benchmark price for a detached home is $1,598,200. This represents a 0.7 per cent increase from June 2017 and a 0.6 per cent decrease compared to May 2018.
Sales of apartment homes reached 1,240 in June 2018, a 34.9 per cent decrease compared to the 1,905 sales in June 2017. The benchmark price for an apartment is $704,200. This represents a 17.2 per cent increase from June 2017 and a 0.4 per cent increase compared to May 2018.
Attached home sales in June 2018 totalled 419, a 37.3 per cent decrease compared to the 668 sales in June 2017. The benchmark price of an attached home is $859,800. This represents a 15.3 per cent increase from June 2017 and is virtually unchanged from May 2018.
Source: REBGV (Real Estate Board of Greater Vancouver)
Market Stats May 2018

Reduced demand is allowing housing supply to accumulate
Home buyer demand continues to decline across the Metro Vancouver* housing market.
The Real Estate Board of Greater Vancouver (REBGV) reports that residential property sales in the region totalled 2,833 in May 2018, a 35.1 per cent decrease from the 4,364 sales recorded in May 2017, and a 9.8 per cent increase compared to April 2018 when 2,579 homes sold.
Last month’s sales were 19.3 per cent below the 10-year May sales average.
“With fewer homes selling today compared to recent years, the number of homes available for sale is rising,” Phil Moore, REBGV president said. “The selection of homes for sale in Metro Vancouver has risen to the highest levels we’ve seen in the last two years, yet supply is still below our long-term historical averages.”
There were 6,375 detached, attached and apartment properties newly listed for sale on the Multiple Listing Service® (MLS®) in Metro Vancouver in May 2018. This represents a 5.5 per cent increase compared to the 6,044 homes listed in May 2017 and a 9.5 per cent increase compared to April 2018 when 5,820 homes were listed.
The total number of properties currently listed for sale on the MLS® system in Metro Vancouver is 11,292, a 38.2 per cent increase compared to May 2017 (8,168) and a 15 per cent increase compared to April 2018 (9,822).
The total number of listings available today is 17.2 per cent below the 10-year May average.
For all property types, the sales-to-active listings ratio for May 2018 is 25.1 per cent. By property type, the ratio is 14.7 per cent for detached homes, 30.8 per cent for townhomes, and 41.7 per cent for condominiums.
Generally, analysts say that downward pressure on home prices occurs when the ratio dips below the 12 per cent mark for a sustained period, while home prices often experience upward pressure when it surpasses 20 per cent over several months.
“For home sellers to be successful in today’s market, it’s important to price your property competitively given the shifting dynamics we’re experiencing,” Moore said. “It’s also important to work with your local Realtor to better understand these changing conditions.”
The MLS® Home Price Index composite benchmark price for all residential properties in Metro Vancouver is currently $1,094,000. This is an 11.5 per cent increase over May 2017 and a 0.2 per cent increase compared to April 2018.
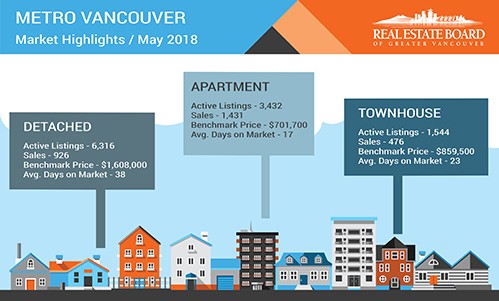
Sales of detached properties in May 2018 reached 926, a 40.2 per cent decrease from the 1,548 detached sales recorded in May 2017. The benchmark price for detached properties is $1,608,000. This is a 2.4 per cent increase from May 2017 and a 0.1 per cent increase compared to April 2018.
Sales of apartment properties reached 1,431 in May 2018, a 29.3 per cent decrease from the 2,025 sales in May 2017. The benchmark price of an apartment property is $701,700. This is a 20.2 per cent increase from May 2017 and a 0.1 per cent increase compared to April 2018.
Attached property sales in May 2018 totalled 476, a 39.8 per cent decrease from the 791 sales in May 2017. The benchmark price of an attached unit is $859,500. This represents a 16 per cent increase from May 2017 and a 0.6 per cent increase compared to April 2018.
*The real estate industry is a key economic driver in British Columbia. In 2017, 35,993 homes changed ownership in the Board’s area, generating $2.4 billion in economic spin-off activity and an estimated 17,600 jobs. The total dollar value of residential sales transacted through the MLS® system in Greater Vancouver totalled $37 billion in 2017.
Source: REBGV (Real Estate Board of Greater Vancouver)
April 2018 Stats - Changing Market!

Market Changes - 1st Quarter 2018 Stats

Fewer home sales and listings in the first quarter of 2018
Home buyers and sellers were less active in Metro Vancouver throughout the first quarter of 2018.
The Real Estate Board of Greater Vancouver (REBGV) reports that residential home sales in the region totalled 2,517 in March 2018, a 29.7 per cent decrease from the 3,579 sales recorded in March 2017, and a 14 per cent increase compared to February 2018 when 2,207 homes sold.
Last month’s sales were 23 per cent below the 10-year March sales average.
There were 6,542 home sales on the Multiple Listing Service® (MLS®) in Metro Vancouver during the first quarter of 2018, a 13.1 per cent decrease from the 7,527 sales over the same period last year. This represents the region’s lowest first-quarter sales total since 2013.
“We saw less demand from buyers and fewer homes listed for sale in our region in the first quarter of the year,” Phil Moore, REBGV president said. “High prices, new tax announcements, rising interest rates, and stricter mortgage requirements are among the factors affecting home buyer and seller activity today.”
There were 4,450 detached, attached and apartment properties newly listed for sale in Metro Vancouver in March 2018. This represents a 6.6 per cent decrease compared to the 4,762 homes listed in March 2017 and a 5.4 per cent increase compared to February 2018 when 4,223 homes were listed.
There were 12,469 homes listed for sale in Metro Vancouver during the first quarter of 2018, a 0.8 per cent decrease from the 12,568 sales over the same period last year. This represents the region’s lowest first-quarter new listings total since 2013.
The total number of homes currently listed for sale on the MLS® system in Metro Vancouver is 8,380, a 10.5 per cent increase compared to March 2017 (7,586) and a 7.1 per cent increase compared to February 2018 (7,822).
“Even with lower demand, upward pressure on prices will continue as long as the supply of homes for sale remains low,” Moore said. “Last month was the quietest March for new home listings since 2009 and the total inventory, particularly in the condo and townhome segments, of homes for sale remains well below historical norms.”
For all property types, the sales-to-active listings ratio for March 2018 is 30 per cent. By property type, the ratio is 14.2 per cent for detached homes, 39.9 per cent for townhomes, and 61.6 per cent for condominiums.
Generally, analysts say that downward pressure on home prices occurs when the ratio dips below the 12 per cent mark for a sustained period, while home prices often experience upward pressure when it surpasses 20 per cent over several months.
The MLS® Home Price Index composite benchmark price for all residential properties in Metro Vancouver is currently $1,084,000. This represents a 16.1 per cent increase over March 2017 and a 1.1 per cent increase compared to February 2018.
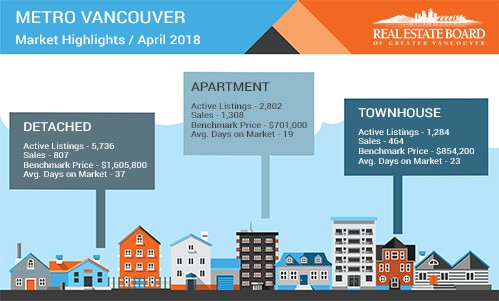
Sales of detached properties in March 2018 reached 722, a decrease of 37 per cent from the 1,150 detached sales recorded in March 2017. The benchmark price for detached properties is $1,608,500. This represents a 7.4 per cent increase from March 2017 and a 0.4 per cent increase compared to February 2018.
Sales of apartment properties reached 1,349 in March 2018, a decrease of 26.7 per cent compared to the 1,841 sales in March 2017. The benchmark price of an apartment property is $693,500. This represents a 26.2 per cent increase from March 2017 and a 1.6 per cent increase compared to February 2018.
Attached property sales in March 2018 totalled 446, a decrease of 24.1 per cent compared to the 588 sales in March 2017. The benchmark price of an attached unit is $835,300. This represents a 17.7 per cent increase from March 2017 and a two per cent increase compared to February 2018.
Source: REAL ESTATE BOARD OF GREATER VANCOUVER
JANUARY 2018 Stats are in!.... Market Update
Home buyer demand depends on property type
Attached and apartment homes are in demand across Metro Vancouver* while detached home buyers are facing less competition today.
The Real Estate Board of Greater Vancouver (REBGV) reports that residential home sales in the region totalled 1,818 in January 2018, a 19.4 per cent increase from the 1,523 sales recorded in January 2017, and a 9.8 per cent decrease compared to December 2017 when 2,016 homes sold.
Last month’s sales were 7.1 per cent above the 10-year January sales average. By property type, detached sales were down 24.8 per cent from the 10-year January average, attached sales increased 14.3 per cent and apartment sales were up 31.6 per cent over the same period.
“Demand remains elevated and listings scarce in the attached and apartment markets across Metro Vancouver,” Jill Oudil, REBGV president said. “Buyers in the detached market are facing less competition and have much more selection to choose. For detached home sellers to be successful, it’s important to set prices that reflect today’s market trends.”
There were 3,796 detached, attached and apartment properties newly listed for sale on the Multiple Listing Service® (MLS®) in Metro Vancouver in January 2018. This represents an 8.3 per cent decrease compared to the 4,140 homes listed in January 2017 and a 100.7 per cent increase compared to December 2017 when 1,891 homes were listed.
The total number of properties currently listed for sale on the MLS® system in Metro Vancouver is 6,947, a four per cent decrease compared to January 2017 (7,238) and a 0.2 per cent decrease compared to December 2017 (6,958).
For all property types, the sales-to-active listings ratio for January 2018 is 26.2 per cent. By property type, the ratio is 11.6 per cent for detached homes, 32.8 per cent for townhomes, and 57.2 per cent for condominiums.
Generally, analysts say that downward pressure on home prices occurs when the ratio dips below the 12 per cent mark for a sustained period, while home prices often experience upward pressure when it surpasses 20 per cent over several months.
The MLS® Home Price Index composite benchmark price for all residential homes in Metro Vancouver is currently $1,056,500. This represents a 16.6 per cent increase over January 2017 and a 0.6 per cent increase compared to December 2017.
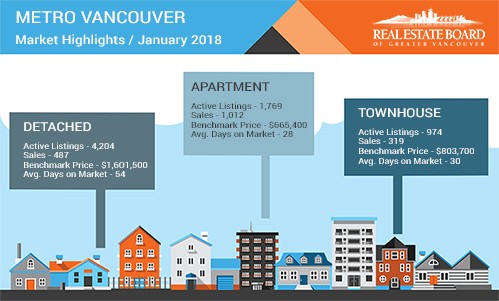
Detached home sales in January 2018 reached 487, a 9.7 per cent increase from the 444 detached sales recorded in January 2017. The benchmark price for detached properties is $1,601,500. This represents an 8.3 per cent increase from January 2017 and a 0.3 per cent decrease compared to December 2017.
Apartment home sales reached 1,012 in January 2018, a 22.7 per cent increase compared to the 825 sales in January 2017. The benchmark price of an apartment property is $665,400. This represents a 27.4 per cent increase from January 2017 and a 1.5 per cent increase compared to December 2017.
Attached home sales in January 2018 totalled 319, a 25.6 per cent increase compared to the 254 sales in January 2017. The benchmark price of an attached unit is $803,700. This represents a 17.5 per cent increase from January 2017 and unchanged compared to December 2017.
Source: Real Estate Board of Greater Vancouver
Market Forcast 2018

What Happened ? (Nov 2017 Market Update)

